
Data Journalism Newsletter
The first newsletter of March is rehashing all the gossip from awards week using data journalism as an informative journo tool and providing examples on how it's used in newsletters…


Dear fellow dedicated journalists!
On today’s agenda - the BAFTAs, the BRITs, and the data that follows, highlighting all the important topics of discussion over the awards period and how data journalism uses graphs and charts to play a crucial role in reporting events and displaying information and capturing historical moments.
It has been a busy week for the creatives and award shows and what wonderful results for the UK! Jessie Buckley won best leading actress for her role in Hamnet and Wunmi Mosaku won best supporting actress for her role in Sinners.
Robert Aramayo beat Timothée Chalamet for the best leading actor for his role in the film ‘I Swear’, a film about John Davidson’s life with Tourette syndrome, which happened to cause quite the controversy on award night!
Not only that, but the BRIT’s celebrated their 47th awards ceremony here in Manchester! The night saw Olivia Dean, Harry Styles and Wolf Alice grace the stage with their mind-blowing performances.
However it was the beautiful Olivia Dean who stole the night away by winning every category which she was nominated for, she won the most awards all evening!
But how does this link into data journalism, what it’s about, how is it used and what is it good for?
What is Data Journalism?
Lesley-Anne Kelly, the head of data journalism at DC Thomson, describes being a data journalist as:
“We tell stories with data, numbers are just words, there’s no need to be frightened of them…we try to bring numbers to life and tell stories involving data in a way that are more accessible to people who might be a bit number phobic or to people who are particularly official readers.”
 Tiktok failed to load.
Enable 3rd party cookies or use another browser
Lesley-Anne breaks down the ways in which data is sourced, used, and formatted. Websites like ourworldindata.org, statista.com and pewresearch.org provide information based on research, surveys, and studies to provide the public with facts and statistics about important topics and issues they may be otherwise unaware of.
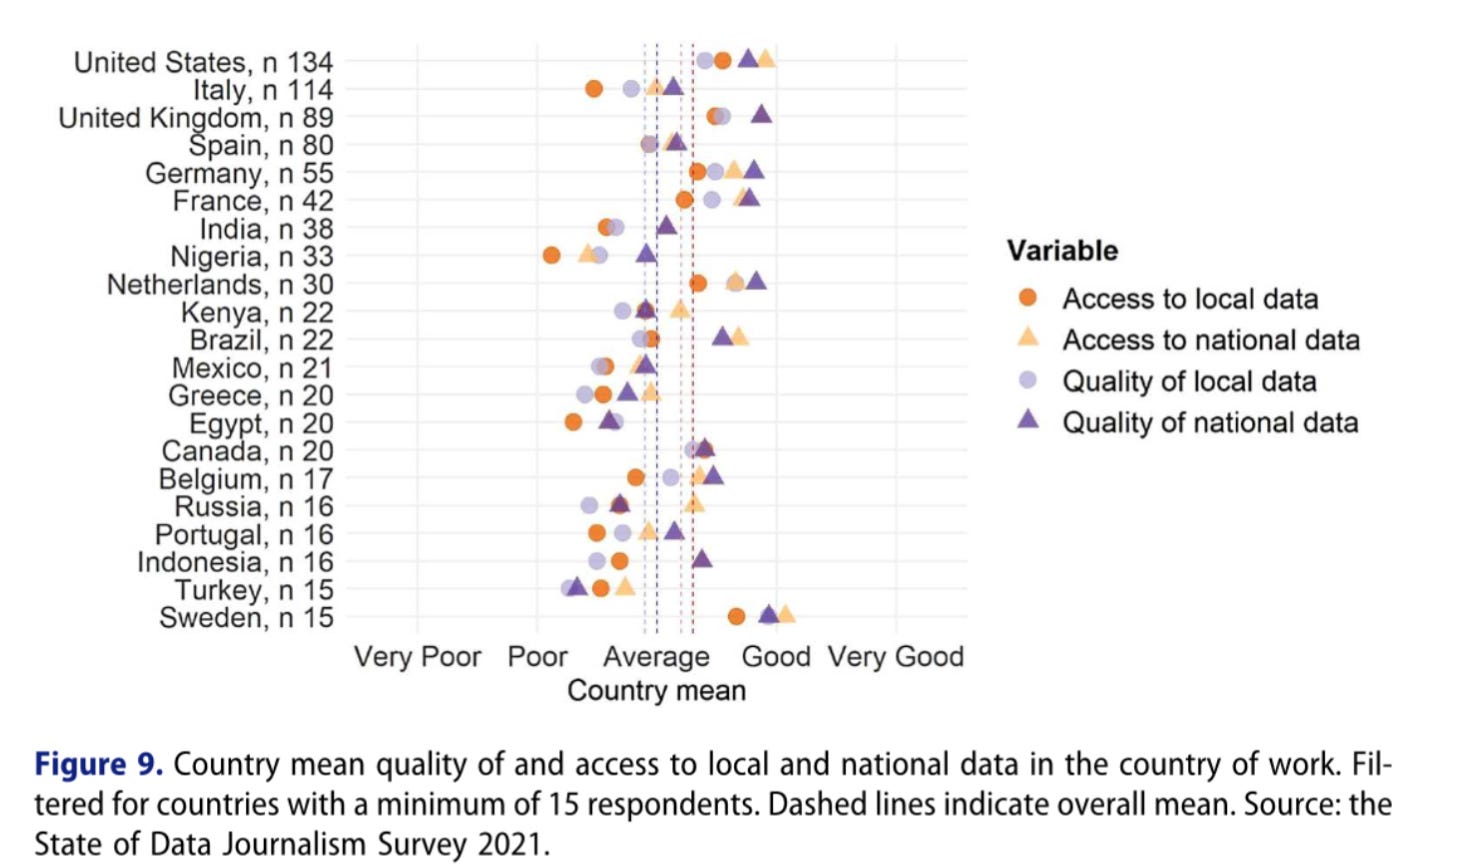
The Open Data Movement argues that official statistics and public databases should be freely available and accessible to everyone. This means that data can be analysed and used to hold the government accountable, bring improvements to public services and use the Freedom of Information laws.
This allows the public to receive information and answers that may not be available until requested. However, depending on the country you’re from, the rules, access and quality of data are significantly different.
The BAFTAS Film Awards 2026
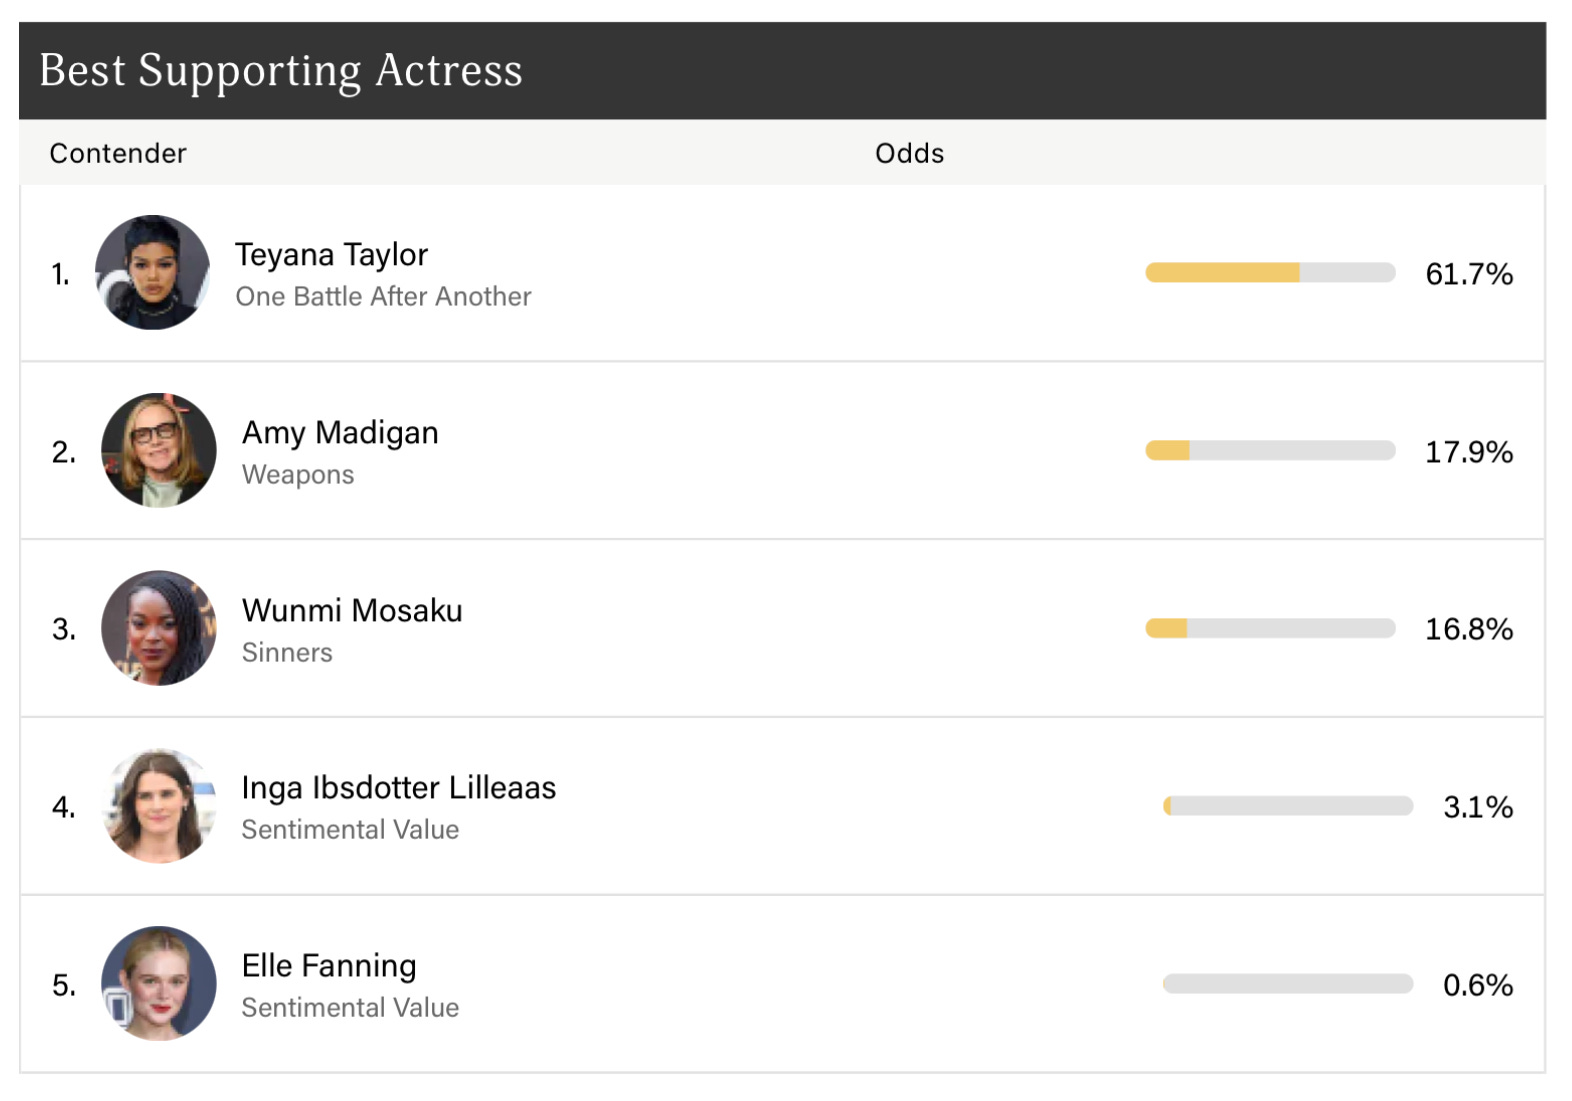
Data journalism is not just for serious and hard-hitting news stories. A website called goldderby.com is the original awards show authority and tracks the biggest competitions within the entertainment industry with predictions and analysis of the news, making data journalism a huge part of their audience appeal.
Gold Derby covers a variety of shows such as the Oscars, Emmys, BAFTAs, Golden Globes, Grammys, and Tonys, and invites their readers to make their own predictions and compete alongside the experts.
Prior to the 2026 BAFTAS, Gold Derby allowed their users to vote and try predicting who would win certain awards. Only 16.8% voted for the winner of the Best Supporting Actress, Wunmi Mosaku, while a whopping 61.7% voted that Teyana Taylor would win for her role in One Battle After Another.
Also incorrectly predicted by Gold Derby users was the winner of the Best Actor category, Timothée Chalamet. The Marty Supreme actor has solidified his status as a serious contender throughout the years by starring in movies like A Complete Unknown, Dune, and Wonka, which explains why he received a huge 61.7% of the vote. The winner, Robert Aramayo did not even make the list!
To get involved and have your say on who you think is going to win upcoming awards, visit www.goldderby.com and see if you agree or disagree with other users!
Data journalism not only provides knowledge but breaks down the knowledge some the public can make informed decisions on topics they otherwise would be ill-informed of, because the story is always in the data!
The BRIT awards 2026
For the first time in the history of the BRIT awards, women and queer people dominated the nominations on Sunday night, marking a landmark moment for gender representation in British music.
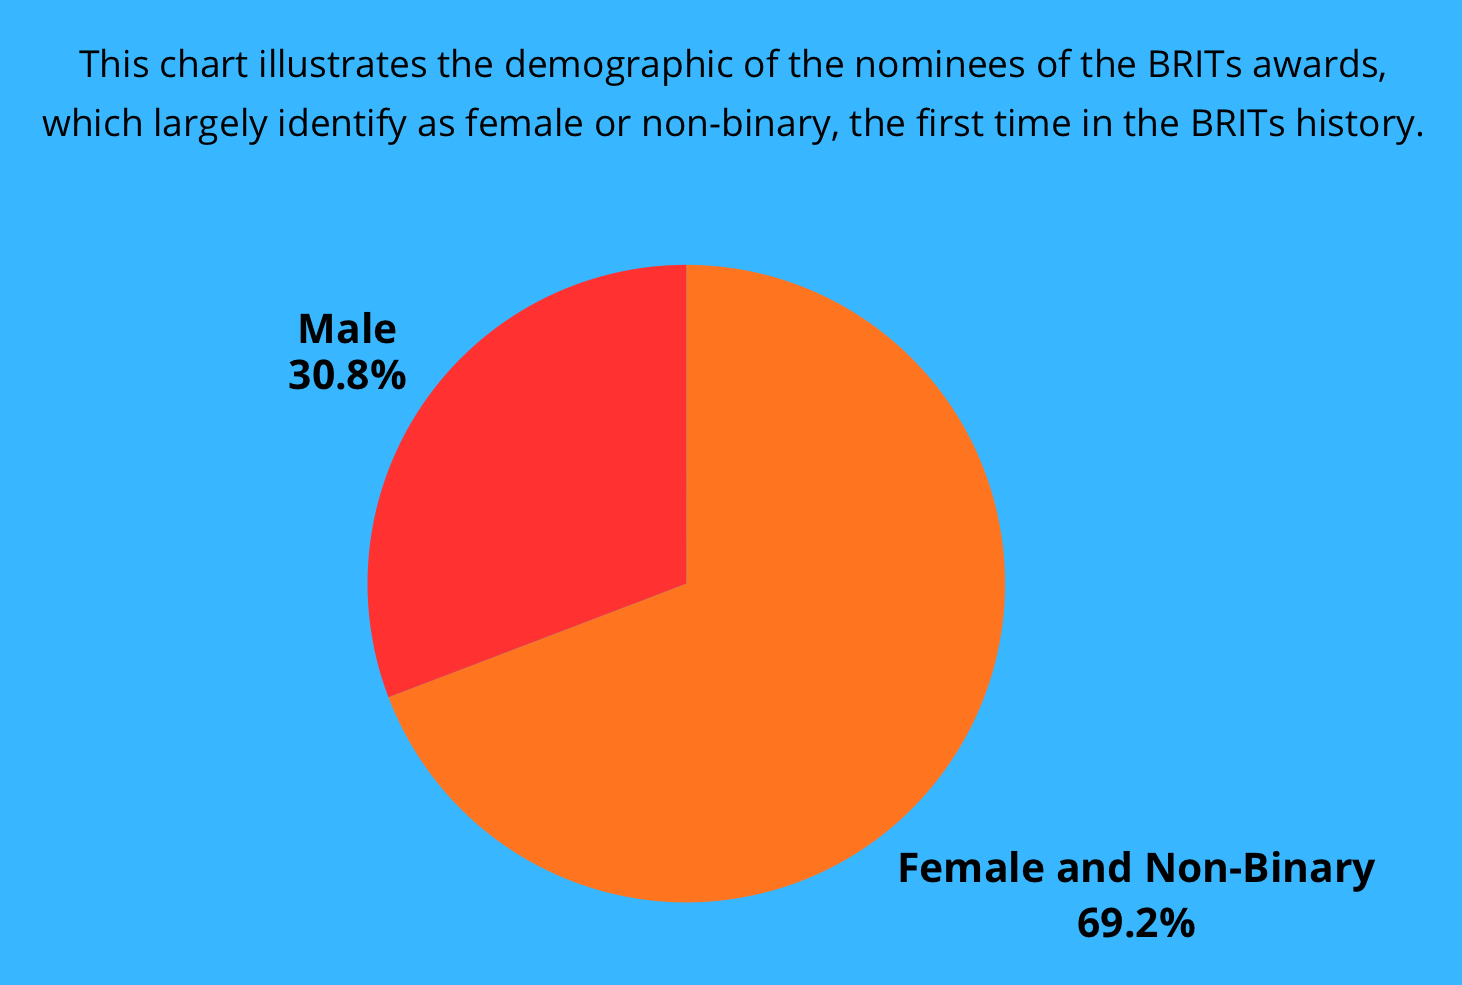
A closer look at nomination patterns over the past decade shows a steady and upward trend in female/queer recognition, meaning that this year isn’t just an anomaly but rather a display of female and queer talent finally having their time at the top of the music industry after many years of men dominating the scene.
By having a look at the nomination counts, the ratios and the category distribution, data journalism helps us move the conversation past just celebrations but towards holding institutions accountable for exploiting women and queer people for their art.
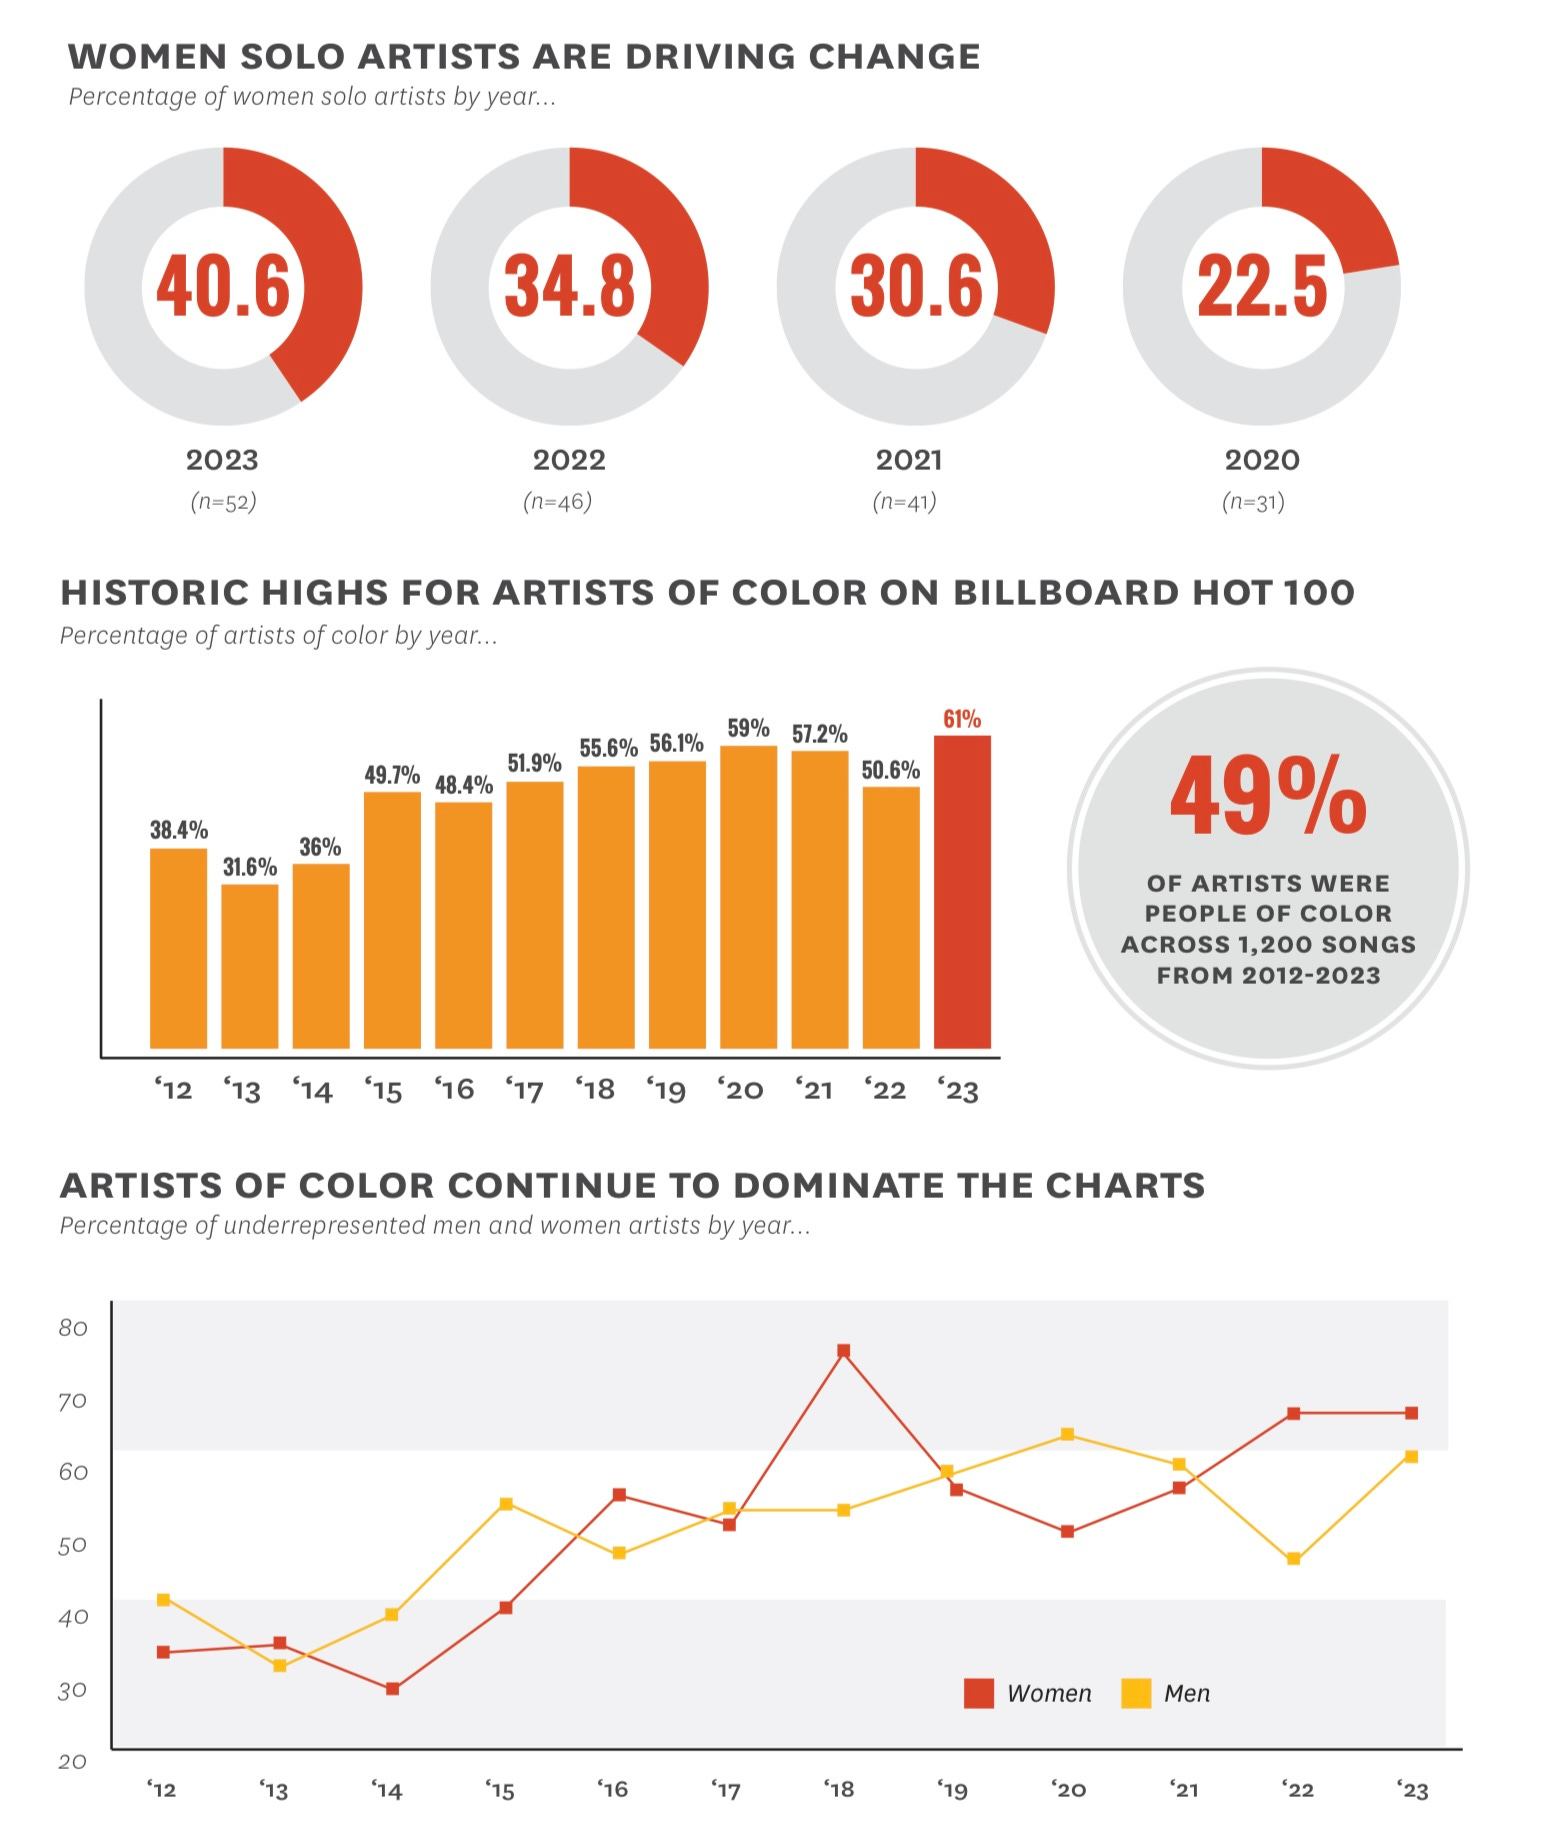
As highlighted above, the data provided by USC Annenberg (inclusion initiative) and Spotify, shows us that between 2020 and 2023, there was an 18.1% increase in the number of solo female artists and also a record number of women of colour in the music charts.
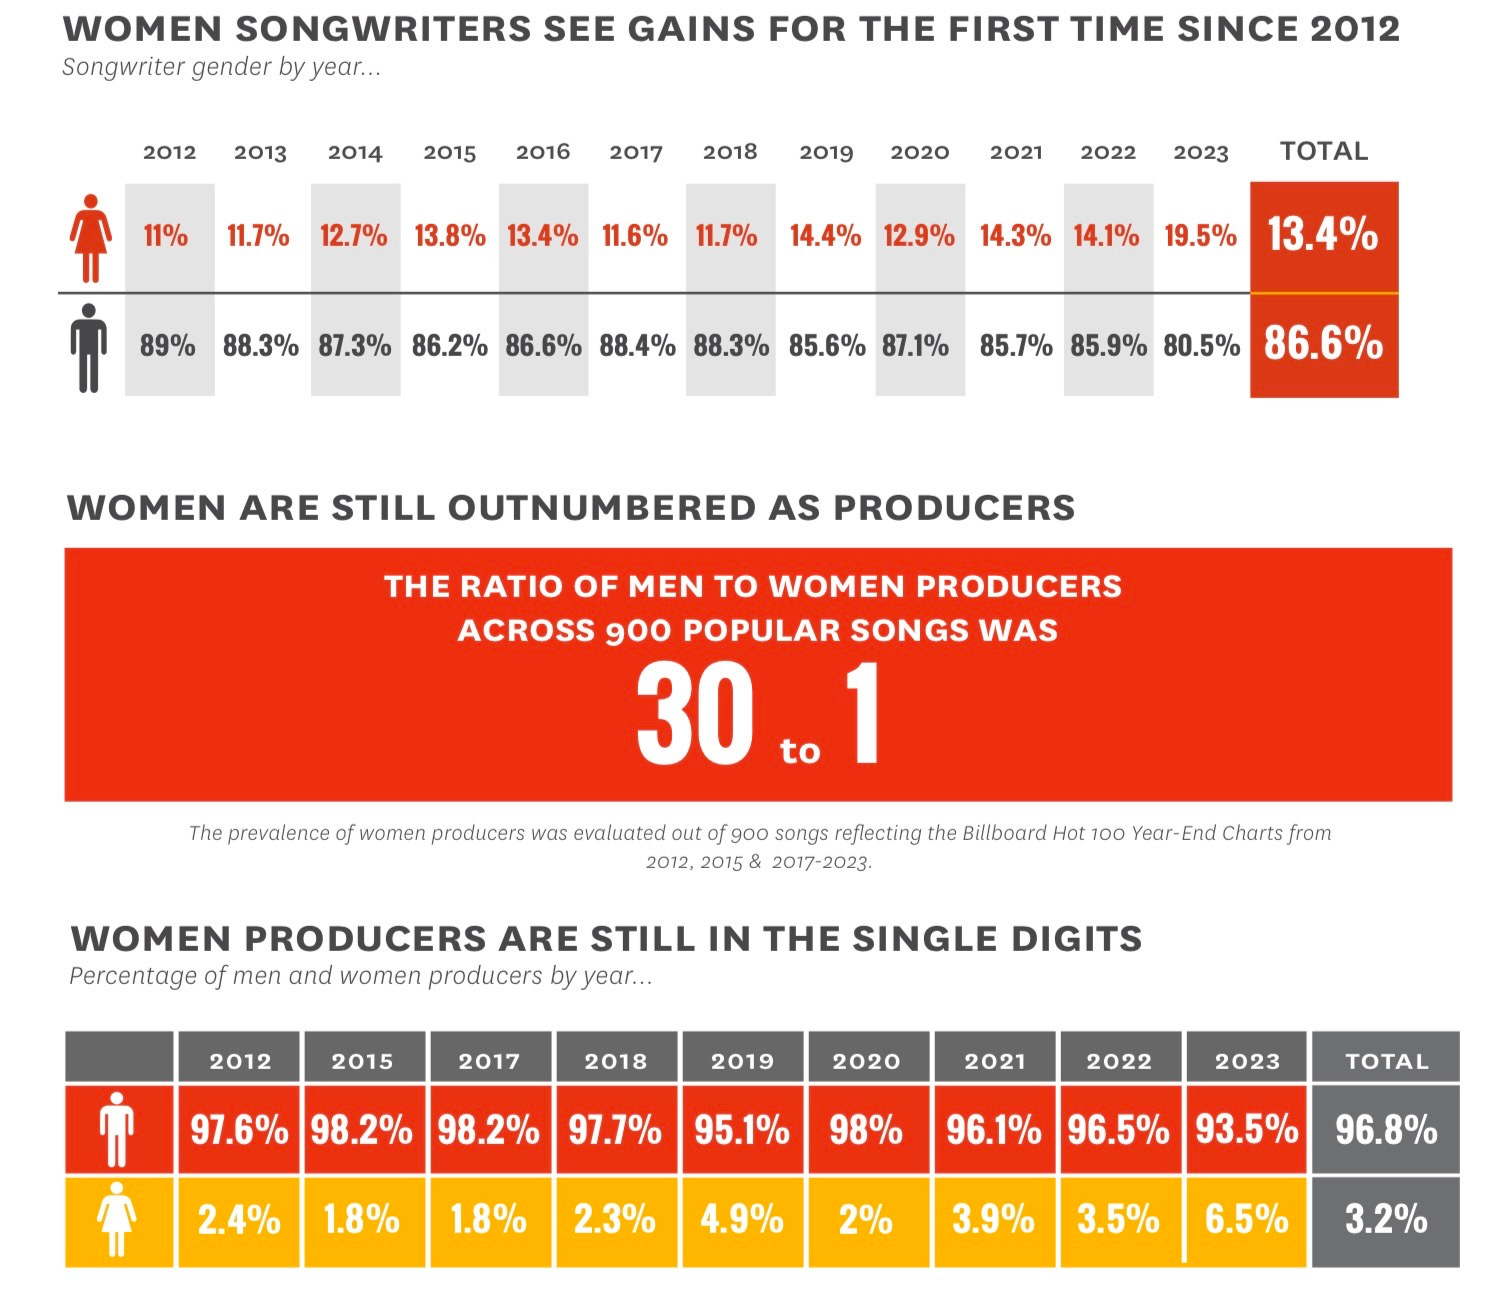
Contrastingly, the data below also shows as much as women are excelling in award nominations, they are still being outnumbered as producers and song writers, with women producers being in the single digits in 2023 at 6.5%, in comparison to the 93.5% of which were men.
Data plays a crucial role whether it’s documenting our humorous predictions on who will win awards or the statistical data that exposes oppression in all kinds of industries, it aids us in understanding the patterns and gives us a deeper insight into the inner workings of the music and film industry.
For more on Data Journalism
If you want to hear more about data journalism, check out The Data Journalism Podcast, hosted by Alberto Cairo and Simon Rogers who deep dive into the latest in data journalism while interviewing experts in the field.
We’ll be back soon with the data that matters,
Amber and Cheyenne!
Don’t miss the next one and subscribe by clicking the button below!
 | A guest post by
|
Love the way you combined recent culture events with data journalism :) Don't do ugly hyperlinks though! We shouldn't see the URLs. Jjust hyperlink the text.